Farms are increasingly becoming data-driven because margins are tighter and risks are higher. Research across precision agriculture frequently shows that crop performance can differ sharply within the same field due to water stress, soil differences, and uneven nutrient uptake, repeatedly long before the human eye notices. That is why Types of remote sensing in agriculture are important: they help teams recognize stress early, prioritize scouting, and make irrigation and input decisions which are evidence based. In this guide, you’ll know how remote sensing works, which sensor types are used, what is NDVI in remote sensing, and how NDVI turns images into actionable field insights.
What Remote Sensing Means in Agriculture
Remote sensing means measuring crops and soil conditions from a distance by using sensors on satellites, drones, aircraft, or ground platforms. It works by capturing how surfaces reflect or emit energy across different wavelengths (called spectral bands).
Key terms (explained simply):
- Reflectance: how much light a crop canopy reflects back to a sensor.
- Spectral bands: “colors” beyond what humans see (like near-infrared).
- Spatial resolution: how detailed the image is (pixel size on the ground).
- Temporal resolution / revisit time: how often the same area is observed.
- Radiometric resolution: how sensitive the sensor is to small differences.
Remote Sensing for Agriculture isn’t only “observing crops.” It means measuring plant vigor, stress signals, and patterns which guide field decisions.
Types of Remote Sensing in Agriculture: A Clear Classification
When people discuss Types of remote sensing in agriculture, they usually mean “where the sensor sits” and “how the data is captured.” Here are the major categories.
Satellite Remote Sensing
Satellites provide wide-area coverage and consistent historical records, which are useful for seasonal tracking and benchmarking.
Ideal for:
- Large-area monitoring (districts, canal commands, regions)
- Weekly to multi-day crop health tendencies
- Comparing current seasons with past seasons
Tradeoffs:
- Cloud cover can block optical imagery
- Very high-resolution imagery may be expensive
Drone (UAV) Remote Sensing
Drones provide high detail and flexible timing. They are best when you need field-level clarity.
Perfect for:
- Discovering within-field variability
- Scouting problem hotspots
- Forming prescription maps (variable-rate zones)
Tradeoffs:
- Limited coverage per flight
- Needs operational planning and trained staff
Aircraft and Manned Aerial Surveys
Aircraft are midway between satellite and drones: larger coverage than drones and repeatedly higher quality control.
Perfect for:
- Large commercial farms
- Multi-farm programs and seasonal mapping campaigns
Tradeoffs:
- Scheduling and budget can be higher than drones
Ground-Based / Proximal Sensing
These systems are close to the crop handheld, tractor-mounted, or station-based, often combined with IoT.
Ideal for:
- Ongoing monitoring (soil moisture, canopy temperature)
- Calibration and validation of imagery insights
Tradeoffs:
- Only point-based coverage (you measure “here,” not everywhere)
Pro Tip: The smartest programs are a combination of multiple Types of remote sensing in agriculture i.e. satellites for trends, drones for detail, and ground sensors for validation.
Sensor Types Used in Agriculture
Sensor choice identifies what you can measure. These are the core sensor types used across different Types of remote sensing in agriculture:
1) RGB Cameras
What measures:
- Visible light (red, green, blue), like a normal photo
Typical uses:
- Stand counts, canopy cover, lodging detection
- Visual scouting support and documentation
Limitations:
- Limited sensitivity to early stress as compared to spectral sensors
2) Multispectral Sensors
What measures:
- A few keynote bands (commonly Red, Green, Blue, Red Edge, NIR)
Usual uses:
- NDVI and vegetation indices
- Early vigor and stress signals
Limitations:
- Less “fine-grained” than hyperspectral data
3) Hyperspectral Sensors
What measures:
- Dozens to hundreds of narrow bands
Standard uses:
- Subtle stress recognition (nutrient stress, disease signatures)
- Research-grade crop characterization
Limitations:
- Higher expense, complex processing, heavier data volumes
4) Thermal Sensors
What measures:
- Canopy temperature (heat emission)
Usual uses:
- Irrigation stress detection
- Spotting under-irrigated zones and blocked emitters
Limitations:
- Involves careful timing (midday can be informative but variable)
- Needs calibration for wind and humidity effects
5) LiDAR
What measures:
- 3D structure (canopy height, terrain, micro-topography)
Typical uses:
- Drainage planning, leveling checks
- Biomass proxies in some crops
Limitations:
- Cost and processing difficulty can be higher
These sensor types provide power to Remote Sensing for Agriculture programs from basic monitoring to advanced crop intelligence.
What Is NDVI in Remote Sensing?
To appreciate field insights, you must understand what NDVI is in remote sensing.
NDVI (Normalized Difference Vegetation Index) quantities vegetation vigor by comparing:
- Red light (absorbed by chlorophyll)
- Near-Infrared (NIR) (reflected strongly by healthy plant cells)
A simple NDVI formula (in text form):
- NDVI = (NIR – Red) / (NIR + Red)
How to read NDVI values:
- Close to 1: dense, healthy vegetation
- Around 0: bare soil, low vegetation
- Negative values: water, clouds, or non-vegetated surfaces
What can NDVI tell you:
- Comparative plant vigor and canopy development
- Spatial variability (strong vs weak zones)
What NDVI cannot tell you (by itself):
- The particular cause of stress (water vs nutrients vs disease)
- Root-level problems without supporting data
That’s why Types of remote sensing in agriculture work best when NDVI is combined with field checks and context data.
NDVI Uses in Agriculture: Field Insights That Farmers and Engineers Actually Need
The operational value of NDVI stems from its capacity to inform crop management strategies and refine temporal applications.
Top uses (field-ready):
- Crop vigor monitoring across the season
- Irrigation stress detection (when NDVI drops in specific zones)
- Early disease/pest signals (unusual patches, pattern growth over time)
- Fertilizer effectiveness checks (response after application)
- Yield prediction support (trend-based, not “magic numbers”)
- Planting uniformity (identify gaps and weak emergence)
- Replant decisions (quantify how much stand is missing)
- Harvest timing zones (manage variability in maturity)
- Trial comparisons (varieties, treatments, irrigation schedules)
Quick Example: After an irrigation cycle, NDVI remains stable in most of the field but declines in one corner. That corner becomes the first scouting target, often showing a blocked line, poor pressure, or drainage issues. This is how NDVI uses in agriculture decreases wasted time and prevents yield loss.
Remote Sensing for Agriculture: How It Works End-to-End
Here’s the operational workflow that most teams follow for Remote Sensing for Agriculture. It’s simple, repeatable, and scalable.
Step by step:
- Choose the objective
- Irrigation scheduling, vigor monitoring, crop modelling inputs, scouting
- Collect imagery
- Satellite, drone, aircraft, or a combination (a key choice among Types of remote sensing in agriculture)
- Preprocess data
- Cloud masking (for satellite)
- Radiometric calibration (for drones)
- Geo-referencing and mosaicking
- Compute indices
- NDVI and other indices (depending on crop and purpose)
- Classify zones
- High/medium/low vigor zones; stable vs declining zones
- Ground-truth (field checks)
- Validate what the map suggests (don’t skip this)
- Create recommendations
- Irrigation fixes, targeted scouting, variable-rate actions
Common Mistake: Regarding a single NDVI map as the final answer. Real value comes from trend analysis (week-over-week) plus field validation.
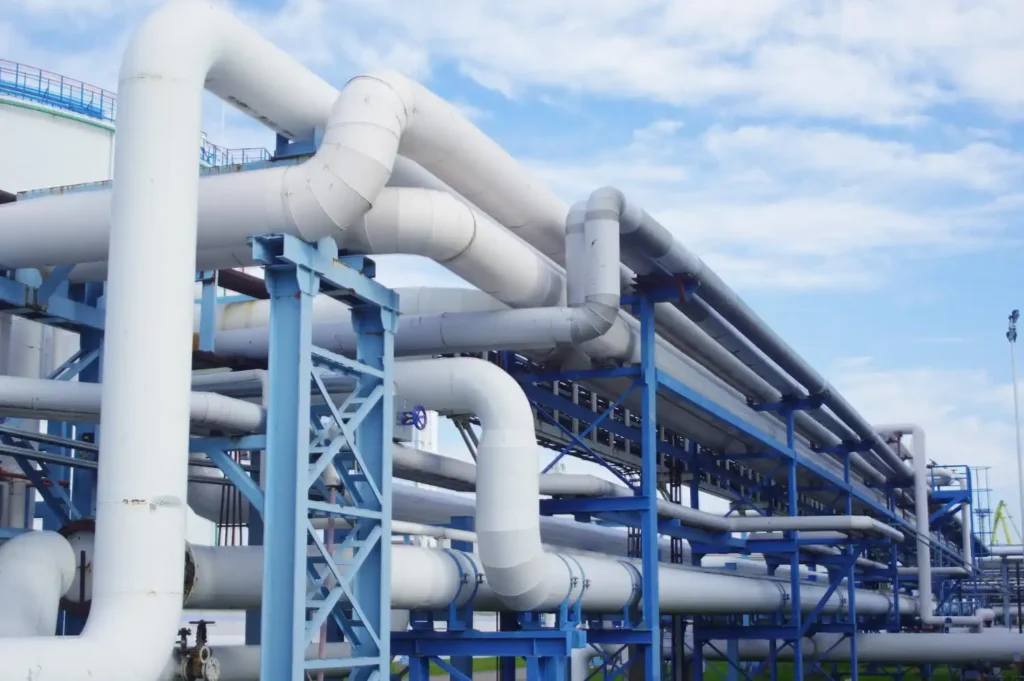
Remote Sensing for Agricultural Water Management (Irrigation + Water Productivity)
remote sensing for agricultural water management is one of the most convincing use cases because water stress shows up as measurable changes in plant condition.
What it Enables:
- Spotting under-irrigation (stress zones, dry patches)
- Identifying over-irrigation (poor vigor due to waterlogging)
- Supporting irrigation scheduling using crop condition trends
- Monitoring canal command areas and distribution performance
- Estimating relative water productivity across zones
Simple ET Context:
- Evapotranspiration (ET) is water loss from soil evaporation + plant transpiration.
- Remote sensing can help understand crop conditions that correlate with ET behavior and stress.
Practical Applications:
- Prioritize “fix first” zones for blocked emitters
- Decrease pumping by avoiding unnecessary cycles
- Identify low-pressure zones that drive uneven application
Remote sensing for agricultural water management becomes a powerful decision layer across irrigation systems when it is paired with field sensors.
How Remote Sensing Is Applicable for Agriculture
If someone asks how remote sensing is applicable for agriculture, the best answer is that “it fits different farm sizes in different ways”.
Use cases by scale:
- Smallholder clusters
- Advisory maps through weekly satellite monitoring
- Scouting prioritization that is at cooperative-level
- Medium farms
- Satellite + drone scouting for problem diagnosis
- Prescription zones for fertilizer and irrigation tuning
- Large agribusiness
- Multi-farm dashboards, standard KPIs, and trend analytics
- Automated alerts for declining zones and anomalies
Institutional and ecosystem use cases:
- Irrigation departments
- Monitor cropping patterns and water production over command areas
- Insurance and credit
- Validate crop status and stress events for risk measurement
- Research and extension
- Estimate trial performance across geographies
This is why Types of remote sensing in agriculture should be selected based on decision for needs, not hype.
Remote Sensing Applications for Agriculture and Crop Modelling
remote sensing applications for agriculture and crop modelling have a focus on turning imagery into model-ready inputs and better forecasts.
How remote sensing supports crop models:
- Provides proxies for canopy development (e.g., greenness trends)
- Helps estimate stress timing and severity
- Improves model calibration with spatial alterability
Typical model workflow (practical):
- Remote sensing maps describe zones
- Field observations confirm key zones
- Crop models simulate yield and water/nutrient demand under scenarios
- Output guides irrigation plans, input timing, and risk strategies
What outputs look like:
- Yield potential maps by zone
- Water stress risk windows
- Fertilizer response zones
When done well, remote sensing applications for agriculture and crop modelling decrease guesswork and strengthen farm planning.
Advantages vs Limitations
Advantages
- Early recognition of stress before visible symptoms
- Scalable monitoring across large areas
- Better targeting of scouting and interventions
- Diminished water and fertilizer waste through zone-based actions
- Historical analysis for learning and planning
- Strong support for remote sensing for agricultural water management
Limitations
- Cloud cover challenges for optical satellites
- Mixed pixels in small fields (coarse resolution issues)
- Needs good calibration and consistent processing
- NDVI alone can’t diagnose the cause of stress
- Skills and workflow adoption are vital
Pro Tip: The best programs treat imagery as a “triage tool.” It tells you where to look and what to trace, not what to blindly suppose.
Financial Aspects and ROI: Turning Images Into Savings
Remote sensing becomes “worth it” when it changes actions and decreases costs. A clear ROI view helps to justify investments in Types of remote sensing in agriculture.
Typical cost buckets:
- Imagery costs (free/public vs commercial)
- Drone hardware and operations (if used)
- Software and processing (analytics platform)
- Field scouting and ground-truthing
- Training and workflow setup
Where savings and gains come from:
- Decreased water use (fewer unnecessary cycles)
- Decreased fertilizer waste (targeted application)
- Higher yield stability (early stress intervention)
- Decreased rework and fewer “late-season surprises”
- Risk decline (drought, heat events, disease spread)
Simple ROI formulas:
- Annual savings = (water saved value) + (fertilizer saved value) + (yield gain value)
- ROI % = (Annual savings – Annual cost) / Annual cost × 100
- Payback period = Project cost / Annual net savings
Even a lightweight approach, i.e. satellite monitoring + focused field scouting, can deliver meaningful returns, especially in irrigation-heavy regions. This is where Remote Sensing for Agriculture becomes a finance-friendly tool, not just technology.
How to Select the Best Types of Remote Sensing in Agriculture for Your Goals
Selecting the right Types of remote sensing in agriculture is easy when you coordinate tools to decisions.
A practical selection guide:
- If you need weekly trends across many fields → start with satellites
- If you need high-detail diagnosis in a few fields → add drones
- If you need continuous validation → add ground sensors
- If your prioritse remote sensing for agricultural water management → combine NDVI trends with thermal checks and field pressure/flow data
When your system is ready, IM Services can support structured operation planning, helping teams classify objectives, choose sensor approaches, and build a repeatable workflow that links maps to action.