Smart cities engineering is becoming critical as cities are growing fast whereas budgets aren’t. The World Bank notes the urban population is anticipated to more than double by 2050, with nearly 7 in 10 people living in cities. Meanwhile, congestion and service inefficiencies silently drain public money. INRIX reported the typical U.S. driver lost 42 hours to congestion in 2023, with an assessed $733 in lost time value per driver. McKinsey’s research suggests smart city functions can improve certain quality-of-life indicators by 10–30%, which often associates with operational improvements and better targeting of public spending.
This guide explains what is a smart city? what smart cities engineering actually means, the technologies behind it, the engineering core areas, and how cities can improve infrastructure costs with measurable financial outcomes.
What Is a Smart City? From Concept to Engineering
A smart city uses data + connectivity + operations discipline to provide better services (mobility, water, energy, safety, waste) with higher dependability and lower lifecycle cost—while safeguarding privacy and security.
Smart Tech Projects Vs Smart Cities Engineering
Many cities run “smart projects” (a few sensors, a dashboard, a pilot app). Smart cities engineering is different. It’s a coordinated approach that:
- designs systems end-to-end (assets → sensors → networks → platforms → operations)
- guarantees interoperability across departments
- builds cybersecurity and resilience in from day one
- manages CAPEX (Capital Expenditure) and OPEX (Operating Expenditure) as a single lifecycle equation
In other words: smart cities engineering is about engineering results, not buying gadgets.
What Is Smart City Infrastructure?
It includes layers, not just devices:
- Physical assets: roads, bridges, pumps, pipes, streetlights, buildings, fleets
- Sensing layer: meters, cameras (where appropriate), environmental sensors, pressure/flow sensors
- Connectivity layer: fiber, LTE/5G (Fifth Generation), LoRaWAN (Long Range Wide Area Network), Wi-Fi
- Platforms + integration: data platform (cloud/edge), Application Programming Interfaces (APIs), integration middleware
- Analytics + automation: Artificial Intelligence (AI) models, rules engines, alerts, optimization
- Operations layer dispatch, maintenance, incident response, SLAs, workflows
- Governance layer: privacy, security, data ownership, procurement rules, performance reporting
This is the foundation of smart cities engineering—each layer must work together reliably.
Core Technologies Behind Smart Cities Engineering
Below are the building blocks you’ll see repeatedly in smart cities engineering programs.
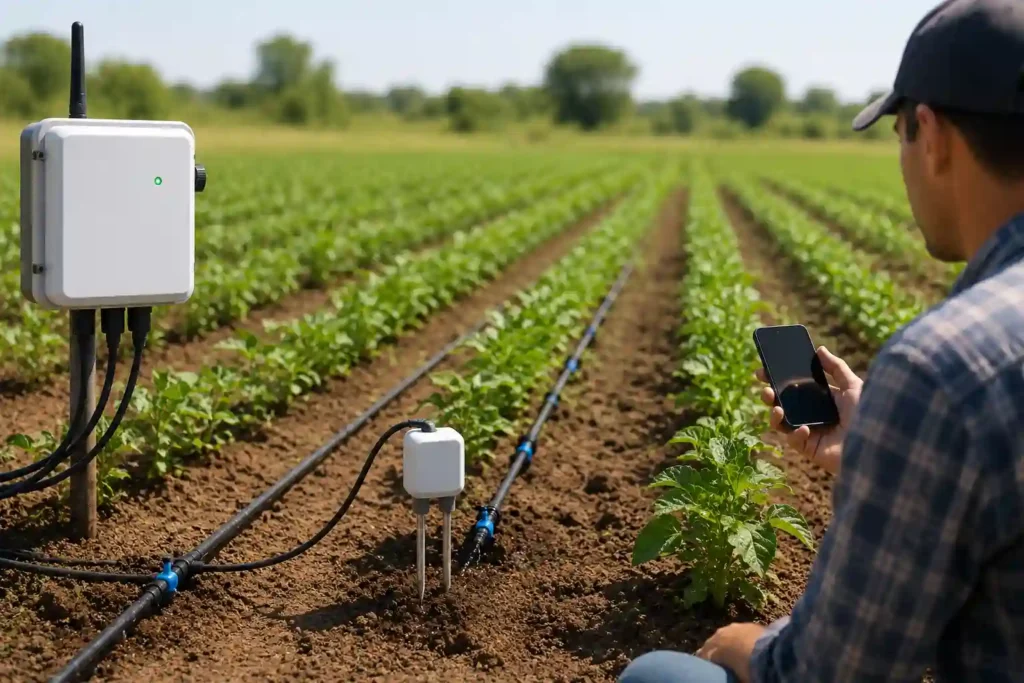
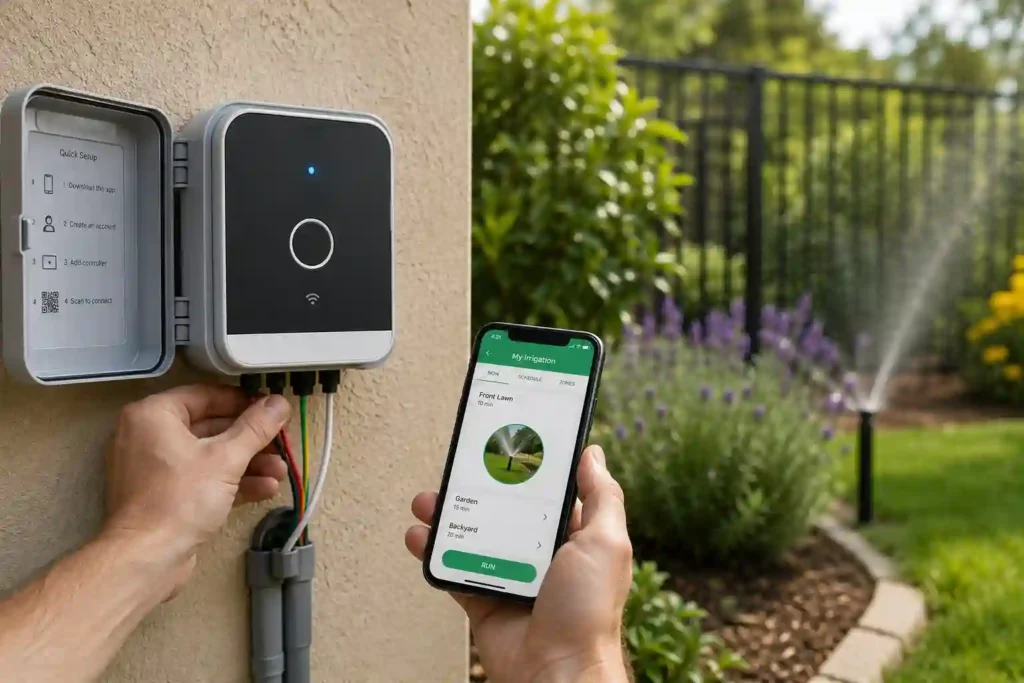
Iot Sensors and Edge Devices
Internet of Things (IoT) devices are sensors and controllers that measure and act:
- smart meters (water/energy)
- pressure/flow sensors (leak detection)
- traffic counters and signal controllers
- environmental sensors (air quality, noise, heat)
Connectivity
- Fiber: high-capacity backbone for city networks
- LTE/5G: wide coverage for mobile assets and distributed sensors
- LoRaWAN: low power for long-range sensor networks
- Wi-Fi: good for localized coverage (buildings, campuses)
Data Platforms + Apis
- cloud and edge platforms store and process sensor data
- APIs share data safely across departments and vendors
Ai Analytics
AI is used for:
- predicting demand (traffic, energy, water)
- abnormality detection (leaks, theft, equipment faults)
- optimization (routes, dispatch, signal timing)
Gis Mapping and Spatial Analytics
A Geographic Information System (GIS) links every asset and event to location:
- asset inventory maps
- outage and incident heatmaps
- risk-based prioritization by neighborhood/zone
Digital Twin
A Digital Twin (DT) is a living digital interpretation of physical assets and processes used for:
- scenario testing (“what if we change signal timing?”)
- asset health tracking
- planning interventions with less guesswork
Operational Systems Integration
- Supervisory Control and Data Acquisition (SCADA): monitors/controls water, power, industrial systems
- Building Management System (BMS): controls HVAC, lighting, energy in facilities
- Common Data Environment (CDE): governed repository for models, documents, and asset data (common in engineering programs)
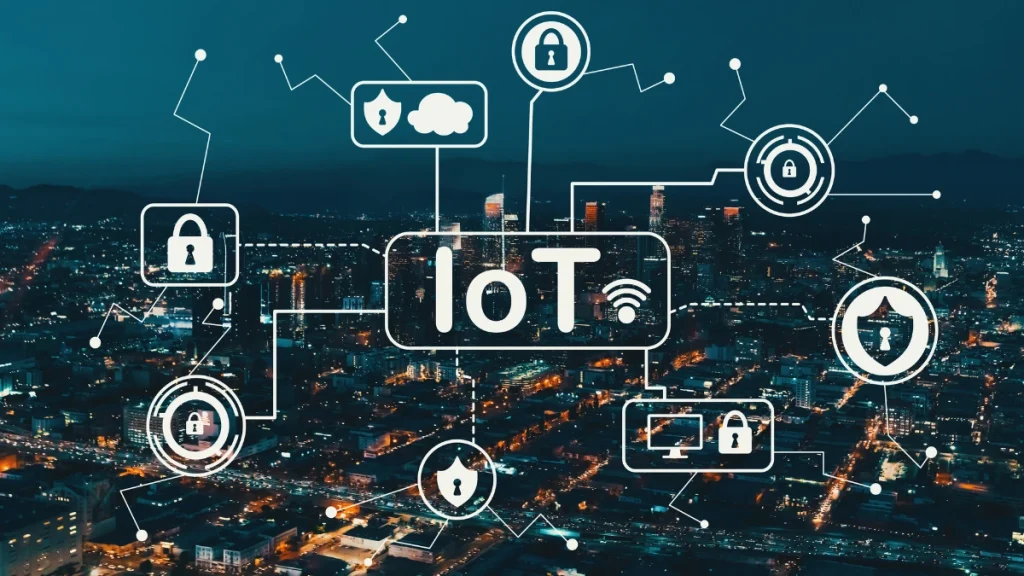
Cybersecurity + Interoperability
Security and open standards matter as cities are long-lived systems:
- identity and access controls
- secure device onboarding
- data model consistency (conceptually: common schemas)
Engineering Focus Areas and Use Cases
This is where function of IoT in smart city becomes real—and where the benefits of smart city show up as measurable KPIs.
Mobility and Traffic Management
Use cases:
- adaptive traffic signals utilizing congestion sensors
- incident recognition and quicker response routing
- public transport precedence at intersections
Cost impact:
- lowered delays, fewer secondary incidents, better productivity
Water Supply and Leakage Reduction
Use cases:
- district metered areas (DMAs) with pressure management
- smart meters for demand patterns and billing precision
- leak recognition via flow/pressure anomalies
Why this matters: World Bank research highlights how high non-revenue water and leakage can damage utility performance and finances.
Waste Management
Use cases:
- bin-fill sensors + route optimization
- service verification and performance monitoring
Cost impact:
- less wasted trips, better fleet deployment, cleaner streets
Energy and Grid Optimization
Use cases:
- smart meters and demand response
- city facility energy dashboards (schools, hospitals, offices)
- streetlighting controls (dimming, fault alerts)
Cost impact:
- lesser energy consumption, faster fault repair, better planning
Public Safety and Emergency Response
Use cases:
- event reporting + dispatch optimization
- situational recognition dashboards (carefully governed)
- improved response time tracking
Cost impact:
- lowered response time, better resource allocation
Buildings and Facilities
Use cases:
- optimize HVAC schedules based on occupancy
- identify abnormal consumption and equipment defects
- preventive maintenance organizing
This is a “quick ROI” area for smart cities engineering as cities often operate many facilities with measurable energy baselines.
Smart City Data Management: Turning Data into Decisions
Smart city data management is the discipline of selecting raw data and turning it into actions that improve services and decrease costs.
A practical pipeline looks like this:
- Collect: sensors, SCADA/BMS feeds, GIS inventories, citizen reports
- Clean: remove duplicates, fix timestamps, validate ranges, normalize units
- Govern: ownership, access controls, privacy rules, retention policies
- Integrate: consistent IDs for assets; APIs to link departments
- Analyze: dashboards, alerts, prediction, anomaly detection
- Act: dispatch work orders, modify settings, update plans
- Learn: measure results; tune rules/models
Why Poor Data Management Ruins Roi
Without strong smart city data management, cities face:
- dashboards nobody trusts (bad data quality)
- duplicated systems across departments (higher OPEX)
- vendor lock-in (data trapped in closed formats)
- cybersecurity exposure (unknown devices and unmanaged access)
This is why smart cities engineering is as much about governance and reliability as it is about technology.
Smart City Planning: Step-by-Step Implementation Roadmap
Smart city planning needs a clear sequence. Here’s a proven rollout pattern:
- Define outcomes and KPIs
Choose measurable goals (NRW reduction, response time, energy per facility, congestion minutes). - Asset inventory + baseline assessment (GIS + condition)
If you don’t know what you own and its condition, optimization becomes guesswork. - Select priority corridors/zones (pilot areas)
Pick a bounded area where results can be measured fast. - Design architecture (sensors, connectivity, platform)
Match tech to the problem (don’t overspend on bandwidth where LoRaWAN fits). - Procurement strategy (open standards, vendor management)
Prioritize interoperability, data portability, and clear SLAs. - Deploy + integrate (SCADA/BMS/platform APIs)
Integration is where most value is won or lost—plan it early. - Operations model (roles, SLAs, maintenance)
Define who monitors, who responds, and how work orders are triggered. - Scale and standardize (templates, playbooks, governance)
Standard tags, dashboards, and KPIs so every expansion is cheaper than the last.
Common Consequences
- Vendor lock-in → need open interfaces and data export clauses
- Cybersecurity gaps → device identity + least-privilege access from day one
- KPI misuse → track leading + lagging indicators; avoid vanity dashboards
- Poor change management → train operators; redesign workflows, not just tools
Financial Outcomes: How Smart Cities Engineering Enhances Urban Infrastructure Costs
This is the core business case for smart cities engineering.
Where City Costs Typically Release
- energy losses and ineffective facility operations
- non-revenue water (leaks, metering gaps, theft)
- reactive maintenance (expensive emergency repairs)
- congestion delays and inefficiencies
- underutilized assets (poor visibility into real usage and condition)
How Smart Cities Engineering Lowers Costs
- Predictive maintenance: repair before failure; reduce downtime minutes
- Improved dispatch: fewer wasted trips; faster response
- Leak/loss reduction: quicker detection via pressure/flow patterns
- Energy optimization: better control of facilities and streetlighting
- Lifecycle planning: select renewal based on asset health, not politics or guesses
McKinsey’s research on smart city applications highlights measurable enhancements in outcomes (10–30% in selected indicators), which frequently translates into better operational execution and resource targeting.
TCO: Total Cost of Ownership
Total Cost of Ownership (TCO) = upfront build + ongoing run costs, across the full lifecycle.
CAPEX
- sensors and edge devices
- connectivity upgrades
- platform setup and integration
- cybersecurity tooling and commissioning
OPEX
- software subscriptions and support
- calibration and device maintenance
- staffing (ops center, analytics, field response)
- security monitoring and incident response
- data storage and retention costs
Simple ROI/Payback Example
Assumptions (example only):
- City district spends $2.0M/year on reactive water network repairs and dispatch
- A smart leakage + pressure management program reduces emergency events by 15%
- Annual savings = $300,000
- Program cost (CAPEX + year-1 setup) = $600,000
- Ongoing OPEX = $80,000/year
Year-1 net = $300,000 − $600,000 = −$300,000
Year-2 net = $300,000 − $80,000 = $220,000
Payback ≈ 2.7 years (and faster if NRW reduction increases billed water)
KPIs to Track
- OPEX per asset class (e.g., per pump station, per km of pipe)
- downtime minutes (by service: water, lighting, signals)
- response time to incidents (median and 90th percentile)
- energy per service unit (kWh per facility m², per ML pumped, per light point)
- non-revenue water % / leakage index (where applicable)
- maintenance backlog size and average age
- asset health index (condition + failure risk)
- SLA compliance for contractors/vendors
- cost per incident resolved
- payback period and ROI
Prospects of Smart City Infrastructure: Trends to Watch
The next stage of smart city infrastructure is about scale, control, and resilience.
- City-scale digital twins + scenario modeling
More cities will model policies before building (traffic timing, flood response, asset renewal). - Privacy-by-design + stronger governance
Better consent models, retention limits, and auditing for public trust. - Interoperability and open standards
Reducing vendor lock-in and enabling faster multi-vendor innovation. - Edge computing growth
Processing closer to sensors for faster response and lower bandwidth usage. - Climate resilience analytics
Heat, flooding, drought risk dashboards incorporated into investment planning. - Secure-by-default architecture
Security along with procurement, commissioning, and operations.
This is where smart cities engineering develops into a long-term capability, not a one-time project.