A digital twin for urban planning is becoming necessary since city systems are under pressure from growth, climate risk, and tight budgets. The United Nations (UN) projects that 68% of the world’s population will live in urban areas by 2050, which implies that more demand on water, energy, transport, and housing—frequently in the same outline. At the same time, the International Energy Agency (IEA) highlights that cities account for roughly 75% of global energy consumption and 70% of greenhouse gas emissions, making urban choices central to sustainability consequences. United Nations Office for Disaster Risk Reduction (UNDRR) estimates annual average damages from flooding at USD 388 billion globally.
In that background, a digital twin for urban planning facilitates leaders move from reactive decisions to “test-before-you-build” planning—reducing waste, avoiding failures, and improving services.
What is Digital Twin Technology and How it Works
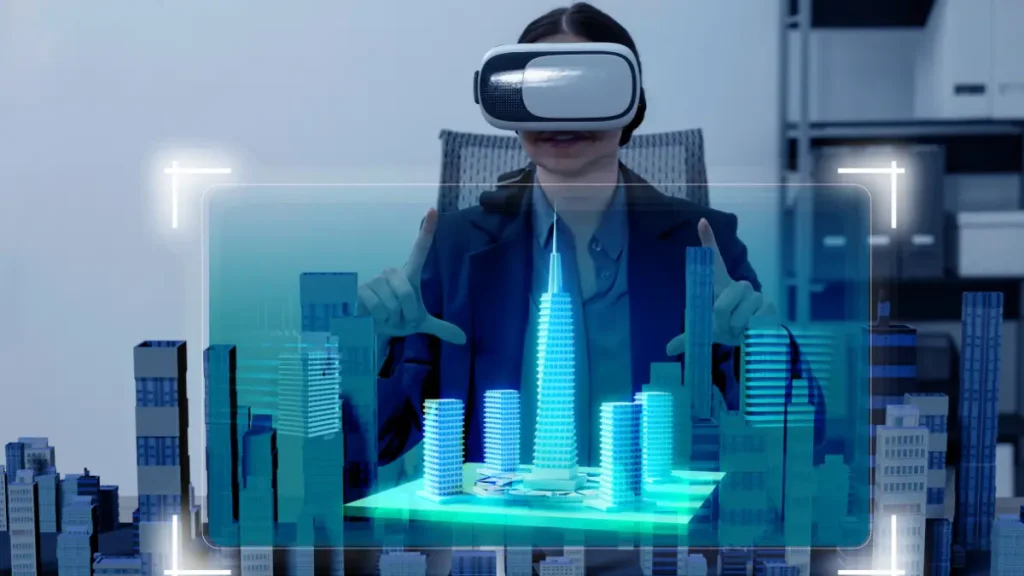
A digital twin is a virtual representation of a real asset or system that stays effective as it is connected to data and updated over time. IBM describes a digital twin as a virtual representation that uses real-time data to mirror a physical object or system’s behavior and conditions. Autodesk also emphasizes that a digital twin is not a static 3D model—it’s an “continuously-changing information model” that can span an asset lifecycle.
A Practical Digital Twin Loop Comprises:
- Represent the city/asset (geometry + attributes)
- Connect operational data (sensors, systems, reports)
- Analyze (simulation, forecasting, scenario tests)
- Act (policy, design, operations, maintenance)
- Learn (feedback improves decisions over time)
This is the reason a digital twin for urban planning is not “just visualization.” It’s a decision engine.
Digital Twin vs 3D Model vs BIM vs GIS
Urban teams often ask: “Do we already have this?”
Here’s the clear difference:
- 3D model: geometry for visualization; usually limited operational meaning.
- Building Information Modeling (BIM): detailed building/asset model for design and construction coordination.
- Geographic Information System (GIS): spatial context—where things are, how they relate, and how patterns behave across an area.
- Digital twin: the connected, time-aware version that fuses models + data + analytics to support decisions.
Environmental Systems Research Institute (Esri) explains that a digital twin is a virtual depiction of reality—comprising objects, processes, and relationships—and when built on a foundation of geography, it becomes a “geospatial digital twin” powered by Geographic Information System (GIS) technology.
For a city, that imples: BIM helps with project-level accuracy, GIS helps with city-scale context, and the twin helps the city operate and plan with evidence. This is especially important for digital twins for urban planning and infrastructure, where roads, drainage, utilities, and buildings interact.
Digital Twin for Urban Planning and Infrastructure
A strong digital twin for urban planning and infrastructure typically needs five layers:
1) Data Sources
- Internet of Things (IoT) sensors (traffic counts, air quality, water pressure)
- Supervisory Control and Data Acquisition (SCADA) from utilities (pumps, reservoirs, substations)
- Satellite and aerial imagery (land use change, heat islands)
- Light Detection and Ranging (LiDAR) for accurate terrain/buildings
- Asset records and work orders (maintenance history, inspections)
- Planning datasets (zoning, parcels, permits)
2) Integration Layer
- APIs, ETL pipelines, data quality rules, identity matching (asset IDs)
3) Analytics + Simulation
- flood modeling, traffic simulation, demand forecasting, risk scoring
4) Visualization
- dashboards, 2D/3D maps, scenario sliders, stakeholder views
5) Governance
- privacy, permissions, cybersecurity, data stewardship
The World Economic Forum (WEF) observes that building digital twin cities needs investment in digital infrastructure and emphasizes planning, governance, and ecosystem coordination.
Digital Twin City and Smart City Digital Twin
A digital twin city generally evolves in stages:
- Asset twin: one bridge, one pump station, one corridor
- System twin: stormwater network, transit network, water distribution
- City twin: integrated systems + cross-domain scenarios (flood + traffic + emergency response)
A smart city digital twin is fundamentally a city twin designed for continuous improvement—where operational data and planning models update each other. That’s what makes a digital twin for urban planning distinct: it connects capital planning with real-world performance.
Digital Twin Civil Engineering and Digital Twin Engineering for Construction
City delivery teams also benefit at project level.
Digital Twin Civil Engineering
Digital twin civil engineering aims on infrastructure assets—roads, bridges, drainage, utilities—where performance degrades over time and failures are costly. The twin facilitates prioritize interventions based on risk, service levels, and lifecycle cost.
Digital Twin Engineering for Construction
Digital twin engineering for construction relates design intent (often from BIM) to construction progress and field conditions. It helps lower redesigns, improve staging, and minimize disruption, principally in busy corridors and utility upgrades.
Advantages of Digital Twins for Planners and City Agencies
The advantages of digital twins become apparent when you frame them as decision improvements:
- Quicker “what-if” testing before committing CAPEX (Capital Expenditure)
- Reliable targeting of OPEX (Operating Expenditure) through risk-based maintenance
- Powerful coordination across departments (planning, utilities, mobility, emergency services)
- Effective public communication (visual, scenario-based engagement)
- Reduced failures through early warning and predictive insights
These are precisely the outcomes cities chase with a smart city digital twin—but only if governance and data quality are handled seriously.
Step-by-step Implementation Roadmap for a Digital Twin for Urban Planning
A realistic plan of implementation is “pilot → prove → scale,” not “boil the ocean.”
- Step 1: Pick a high-value use case
- flood hot spot, traffic corridor, water-loss zone, permitting bottleneck
- Step 2: Define outcomes and KPIs (Key Performance Indicators)
- prevented losses, reduced downtime, quicker approvals, limited redesigns
- Step 3: Build a minimum viable twin
- GIS base + key layers + one simulation or analytics workflow
- Step 4: Connect live or near-live data
- IoT/SCADA feeds, maintenance tickets, incident reports
- Step 5: Run scenario planning
- “If rainfall +20%,” “if bus lane added,” “if pump failure occurs”
- Step 6: Operationalize
- embed twin outputs in weekly decision cycles and capital planning
- Step 7: Scale with standards
- data catalog, asset IDs, access controls, repeatable templates
Mini-scenario 1: Flood risk + Stormwater + Emergency Response
A coastal district faces repeated flooding. The city builds a digital twin for urban planning that links terrain (LiDAR), drainage assets, rainfall forecasts, and road network data.
In office exercises, the twin exhibits which underpasses fail first, which routes become inaccessible, and where pump capacity is inadequate. With that, the city can:
- prioritize targeted drainage improvements (instead of blanket spending)
- stage emergency response and detour plans
- defend investments using avoided-loss estimates
This is direct urban planning cost optimization—especially when UNDRR shows flood losses are already massive and rising.
Financial Outcomes: Urban Planning Cost Optimization and Digital Twin ROI
A digital twin for urban planning is useful when it reduces both CAPEX and OPEX.
How Cities Save Money
Urban planning cost optimization occurs through:
- Scenario testing before design authorization (fewer redesigns and change orders)
- Targeted maintenance (fix the highest-risk assets first)
- Avoided failures (prevent bursts, sinkholes, outages, and cascading impacts)
- Faster review and approvals (less manual checking, fewer re-submittals)
- Reduced disruption costs (shorter closures, coordinated works)
For example, water loss is a main hidden cost: a World Bank report estimates the global cost of Non-Revenue Water (NRW) to utilities at USD 141 billion per year, with massive daily leakage volumes in developing countries. A twin that pinpoints leakage risk zones and prioritizes renewal can turn that into direct financial recovery.
Cost Components
- Data acquisition (LiDAR, surveys, imagery)
- Platform/software (geospatial + simulation + dashboards)
- Integration (APIs, ETL, security, identity mapping)
- Staffing (data engineers, GIS specialists, modelers)
- Training + change management
- Ongoing operations (monitoring, updates, governance)
Simple ROI Mini-Example
Assumptions (example only):
- City flood losses in a district average of $20M/year
- Twin-driven interventions reduce losses by 5% via better upgrades + response
- Annual avoided loss = $1.0M
- Program cost (year 1) = $600k, ongoing annual cost = $250k
Year-1 net benefit = $1.0M − $0.6M = $0.4M
Ongoing net benefit = $1.0M − $0.25M = $0.75M/year
Even modest percentage improvements can justify investment when risks are large.
KPIs to Track
- Avoided flood damage ($) and days of disruption avoided
- Water loss reduction (NRW %, leak response time)
- Maintenance backlog reduction and asset condition scores
- Project delivery time (permit-to-construction start)
- Change order rate and redesign cycles
- Road closure hours avoided (construction coordination)
- Emergency response time improvements in simulated scenarios
- Energy or emissions impact of mobility changes
Privacy and Cybersecurity Basics
A smart city digital twin touches sensitive data. Keep it safe with:
- data minimization (collect only what you need)
- access controls (role-based permissions)
- encryption in transit and at rest
- network segmentation for operational systems (especially SCADA)
- clear public transparency policies for how data is used
Good governance is what allows the digital twin for urban planning to grow responsibly.