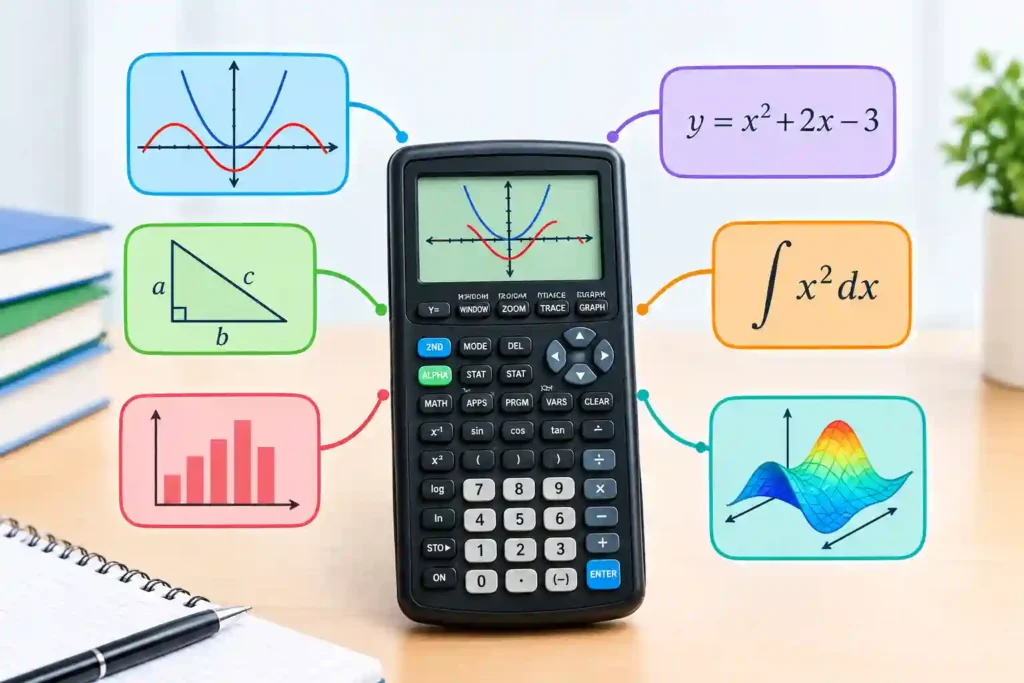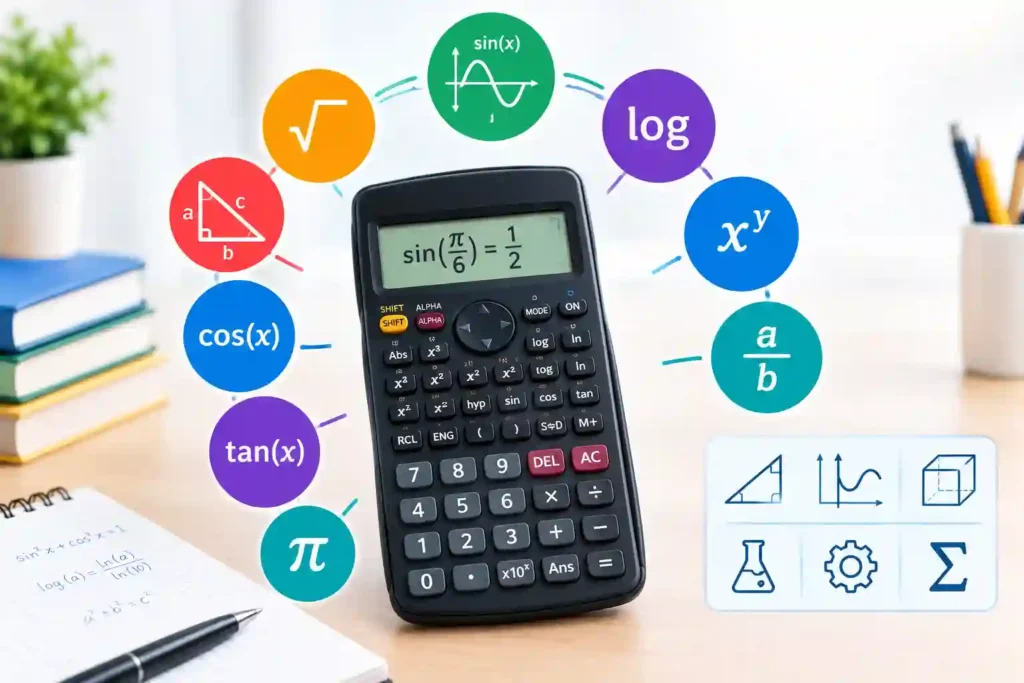
Pew Research Center reported in 2025 that 91% of U.S. adults owned a smartphone, placing calculator software within easy reach. Dedicated graphing devices still provide offline reliability, examination-approved controls, and focused visualization. If you are asking what is a graphing calculator, this guide explains its functions, categories, benefits, limitations, and correct use while connecting to InfraTech Hub’s Different Types of Calculators pillar guide.
What Is a Graphing Calculator and What Can It Do?
A graphing calculator is a handheld device or application that calculates results and plots equations, inequalities, or data on a coordinate plane. Unlike a basic device, it provides variables, statistical tools, memory, and firmware for mathematical exploration.
Common capabilities include:
- Plotting functions such as y = x² − 4
- Finding zeros, intersections, maxima, and minima
- Creating tables, scatterplots, and regressions
- Working with matrices, probability, and calculus on supported models
Understanding what is a graphing calculator includes its limits: it cannot decide whether a model, equation, unit, domain, or assumption is correct.
Graphing Calculator History: From Answers to Visual Models
A defining point in graphing calculator history came in 1985, when Casio released the fx-7000G, identified by the company as the world’s first graphing calculator. Unlike earlier scientific devices, it displayed functions and tabular information visually. Casio says it later entered the Smithsonian collection for its contribution to mathematics education.
The Computer History Museum records that a mass-market handheld cost $245 in 1971, while comparable four-function devices sold for about $10 within a decade. Better processors, displays, batteries, and memory then enabled programmable graphing and color screens.
Modern graphing calculator history includes digital testing, an important stage in graphing calculator history. College Board says Bluebook provides Desmos scientific and graphing modes, while approved SAT handhelds must be non-CAS.
How Does a Graphing Calculator Work?
To answer what is a graphing calculator technically, follow its processing sequence:
1. The keypad or touchscreen records numbers, variables, and commands.
2. Firmware parses the expression and operating mode.
3. The processor evaluates it at selected x-values.
4. Results map to pixels inside the viewing window.
5. Memory stores equations, lists, programs, and values.
6. The display draws curves, tables, or statistical plots.
Graphs are sampled approximations. A poor window, discontinuity, or extreme scale can hide behavior or suggest false connections. Check tables and selected points before interpreting the picture.
How to Graph Functions on a Graphing Calculator
Buttons vary by model, but this process explains how to graph functions on a graphing calculator reliably:
1. Confirm the angle mode for trigonometric functions.
2. Clear unwanted expressions from the equation editor.
3. Enter the function with correct parentheses.
4. Choose a suitable domain and range.
5. Graph and inspect the curve.
6. Use trace, table, zero, intersection, or extrema tools.
7. Verify important coordinates in the original equation.
For y = x² − 4, a standard window reveals x-intercepts near −2 and 2. If the curve looks flat or missing, adjust the window. This approach to how to graph functions on a graphing calculator combines controls with verification.
How to Use a Graph Calculator Accurately
Learning how to use a graph calculator involves more than pressing Graph. Apply these checks:
- Estimate the expected shape and scale.
- Distinguish subtraction from the negative-number key.
- Parenthesize numerators, denominators, and exponents.
- Confirm degrees versus radians.
- Reset unfamiliar window settings.
- Check for disabled equations or plots.
- Avoid early rounding.
- Label units and compare graphs with tables.
A graph is evidence, not proof. High-stakes calculations require validated formulas, controlled data, suitable precision, and qualified review. InfraTech Hub’s Unit Converter can normalize measurements. These habits make how to use a graph calculator a reasoning process.
Main Types of Graphing Calculators
Understanding the types of graphing calculators prevents users from buying unnecessary features or selecting a device prohibited in an examination.
Non-CAS Handheld Models
These graph functions, create tables, perform statistics, and often support simple programs without symbolic computer algebra.
Pros: dependable offline use, familiar classroom design, and broad acceptance in many tests.
Cons: limited symbolic manipulation, small screens, and model-specific menus.
CAS Handheld Models
Computer algebra system devices manipulate expressions symbolically, factor polynomials, solve equations, and may return exact derivatives or integrals.
Pros: powerful advanced mathematics, exact forms, and reduced repetitive algebra.
Cons: greater cost and complexity, examination restrictions, and potential overreliance. College Board currently prohibits CAS calculators in the SAT Suite.
Color and Advanced Handheld Models
These add high-resolution color displays, rechargeable batteries, geometry, spreadsheets, images, or enhanced programming.
Pros: clearer multi-graph comparison and richer visualization.
Cons: higher cost, charging needs, and more complicated menus.
Browser and App-Based Tools
Online tools provide large displays, sliders, sharing, and quick updates on phones or computers.
Pros: excellent interaction, collaboration, and accessibility.
Cons: privacy or connectivity concerns, distractions, and limited acceptance in controlled tests.
These types of graphing calculators differ in symbolic power, portability, price, and permitted use. Course and examination rules should guide the choice. This overview of types of graphing calculators supports an informed selection.
Scientific vs Graphing Calculator: Which Is Better?
The scientific vs graphing calculator decision depends on visualization. Scientific models evaluate trigonometry, logarithms, powers, roots, fractions, and statistics. Graphing models add coordinate plots, tables, larger memory, data analysis, and often programming.
Scientific pros: lower cost, lighter weight, simpler controls, and broad test acceptance. Cons: no coordinate graphing and limited visual analysis.
Graphing pros: links equations, tables, patterns, and regressions. Cons: higher cost, a steeper learning curve, and stricter test policies.
Scientific equipment suits routine technical arithmetic; graphing adds value for transformations, intersections, regressions, and calculus visualization. InfraTech Hub’s Scientific Calculator guide expands the scientific vs graphing calculator comparison.
Where Graphing Calculators Are Used
Graphing calculators support algebra, calculus, statistics, physics, chemistry, economics, engineering, surveying, and programming. Students test transformations, analysts fit regressions, and technicians inspect variable relationships.
Visual convenience cannot replace expertise. Extrapolating beyond data, choosing a poor regression, ignoring units, or accepting a misleading window can produce invalid conclusions.
How to Choose a Graphing Calculator
Before buying, compare syllabus, approved models, display size, battery type, memory, programming support, and warranty. Practice on the same model used during assessments. Professionals should confirm whether color plots, data transfer, CAS capability, or offline reliability improve workflow. The best choice is not the most powerful calculator, but the least complex tool that handles required tasks.
Common Errors to Avoid
- Entering an equation in the wrong form
- Choosing degrees instead of radians
- Using a window that excludes key behavior
- Treating asymptotes as connected lines
- Forgetting stored equations or disabled plots
- Confusing a numerical approximation with an exact result
- Treating correlation as causation
- Using a prohibited device in an examination
Avoiding these mistakes is central to how to use a graph calculator effectively.
Conclusion: Choose the Right Graphing Tool
So, what is a graphing calculator in practice? It connects formulas, tables, data, and coordinate graphs. Choose a non-CAS handheld for classroom use, a CAS model for permitted symbolic work, or a browser tool for exploration. Confirm policies, estimate expected behavior, and verify important points. The answer to what is a graphing calculator should guide readers toward InfraTech Hub’s Graphing Calculator and calculator pillar pages.